WEATHER MONITORING SYSTEMS
Q-Net Systems
• Rugged, powerful, flexible, simple to use
• Multiple sensor choices
• Full lightning protection
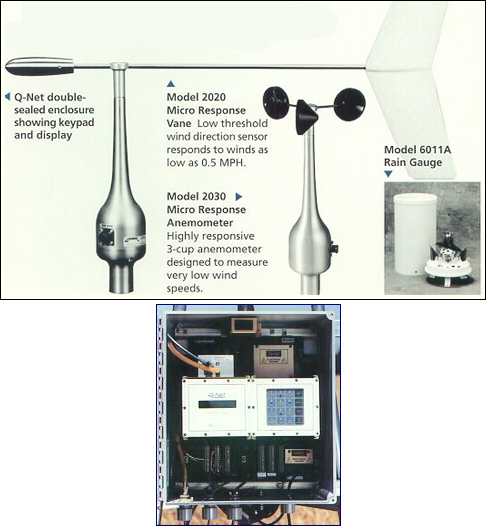
• Dual sealed enclosure
• Variety of telemetry options
• Radio (UHF, VHF, spread spectrum)
• Satellite (GOES, Meteosat, Leos, Argos)
• Telephone, cellular telephone, GSM
• Multiple outputs
• RS485, RS232, FSK, 4-20 ma, 0-10 Vdc
• Solar power option
• Removable memory card option
• Keypad and display for local programming and data display
Description
Q-Net Integrated Systems are a straight-forward solution to the integration problems faced when building an environmental monitoring system for a specific application. The network design of Q-Net provides a flexible framework for assembling any size system from a single sensor system to a complex multi-parameter array.
The building blocks of Q-Net are plug-in modules that work together in whatever combination is required, making Q-Net remarkably adaptable.
Sensor List
• Wind Speed
• Wind Direction
• Temperature
• Relative Humidity
• Barometric Pressure
• Solar Radiation (Global, Net, Long Wave, UVB, etc.)
• Rain Fall
• Evaporation
• Water Level
• Soil Moisture
• Soil Temperature
• Grass Minimum
• Gas Monitors (NOx, SOx, O2, CO, CO2, etc.)
Q-Net Blocks
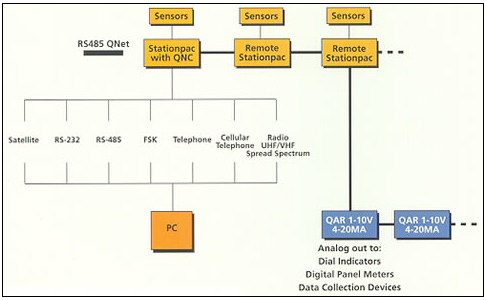
The heart of Q-Net is its RS-485 network, which additional components even full sensor stations to be added on at any stage along the network. The character of the RS-485 interface makes expansion of a system effortless, and simplifies the dissemination of collected data.
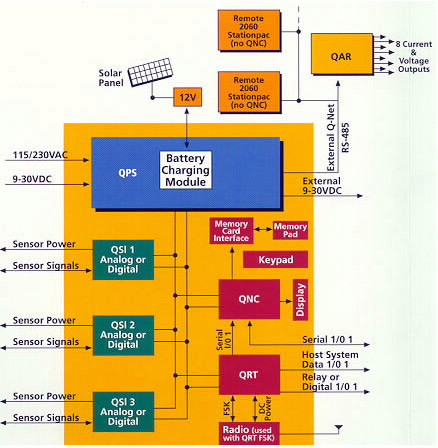
Q-Net Modules
Each Q-Net station includes a NEMA 4X enclosure called a StationPac, which houses the Q-Net modules and auxiliary equipment. For added protection, the Q-Net modules are housed withing the StationPac. There are five Q-Net modules in all, which together control the operation of a Q-Net system.
• The Sensor Interface (QSI) obtains data from either analog or digital sensors.
• The Network Controller (QNC) controls overall operation of the system and provides a data interface to host systems. For on-site data logging, an optional removable Data Archive Card is available.
• The Relay/Telemetry (QRT) modules allow data to be transmitted to a remote location off the Q-Net via any of the telemetry devices.
• The Analog Readout (QAR) provides analog outputs of sensor data to allow the use of analog recorders and displays with a system.
• The Power Supply (QPS) regulates dc power to the system components.
• Power input can be 12 Vdc, battery and/or solar panels, 110 or 230 Vac, 50/60 Hz.
• These five modules provide the flexibility that is the basis of the Q-Net concept. In practice, not every system requires all of them. A basic Q-Net system may require no more than a sensor station (or stations), one QSI, one QNC, and a QPS.
Q-Net Applications
The Q-Net can be used in a variety of applications:
• Pollution Monitoring
• Plume Dispersal Monitoring
• Plume Dispersal Monitoring (using Safer Real Time, Cameo/Aloha, etc.)
• Oil & Gas Plants
• Chelcal Plants (Perimeter Fence Monitoring)
• Water Treatment Plants
• Synoptic Stations
• Climate Monitoring
• Flood Warning & Monitoring
• Hydro-meteorological Stations
• Port & Harbors
• Agriculture
Description
For many industries, monitoring of certain environmental parameters is either required or recommended by the EPA. Designs and builds a variety of systems that meet EPA requirements, and can be tailored to the specific needs of any site.
Plume modeling and perimeter monitoring are two important applications to which systems are specifically suited. The outputs of EPA systems are compatible with the most prevalent plume modeling software packages, and their sensor interfaces accept the outputs of many gas detection sensors (NOX, SOX, CO, CO2, Ammonia, Chlorine, and others).
Alarm functions are buit into EPA systems, with programmable alarm levels that automatically open or clese a relay, or send an alarm sugnal to a host computer via data line or a choice of telemetry links.
Q-Net has been used in many countries for Synoptic and Climate monitoring, transmitting its data via satellite or intelligent radio networks. Its flexibility and power, make it an ideal solution for this equipment.
Q-Net Software
• Powerful, flexible and simple to use
• Programmable display options
• Data base archive
• Report generator
• Programmable channel table
• Programmable storage and transmit times
• Differential temperatures
• Wind gust, standard deviation
• Averages, maximums, minimums
Description
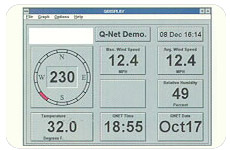 Data collected by a Q-Net system can be output directly to an external computer, via the various telemetry devices. Using Q-Soft, a software interface designed and developed by Qualimetrics, the data can be displayed graphically in multiple formats on any PC. Data collected by a Q-Net system can be output directly to an external computer, via the various telemetry devices. Using Q-Soft, a software interface designed and developed by Qualimetrics, the data can be displayed graphically in multiple formats on any PC.
Q-Soft is a set of Microsoft Windows programs and libraries used to provide an interface between the Q-Net and the user. This software provides options for direct connection to the Q-Net, and interfaces to the optional Memory Card Reader for accessing and receiving stored data.
There are two possible user interfaces for a Q-Net system:
Q-Soft PC software and an optional keypad and display. Most Q-Net systems will benefit from the ease of use and versatility of Q-Soft, with its graphical interface and powerful data manipulation capabilities. Some systems, however, are better suited to the keypad and display option remote systems, (for instance, those not connected to a host computer).
Q-Soft Allows Users to:
•Collect data from the Q-Net through the COM port, either via direct connect, telemetry, or direct connect to the optional Memory Card Reader.
• Perform real-time or batch statistical processing on the data as it is collected. Examples of the most common statistical parameters produced are: averages, running averages, circular averages (wind direction), minimum and maximum, standard deviation, and histograms.
• Generate reports based on these statistical parameters. Reports can be in the form of files or printer output.
• Generate real-time graphic window displays of these parameters. Wind direction can be displayed on a circular wind dial as well as numerically.
• View trends and relationships between parameters on graphs that can be displayed on the screen or printed on the appropriated printer.
• Configure the system, which is done either through a menu system or by means of editing a textual configuration file.
|